
Solar Panel Removal and Reinstall for Roof Replacement in Florida
If you’re replacing your roof and already have solar panels installed, you’ll likely need solar panel removal and reinstall during the process. When planned correctly,

Choosing among the 7 Best Solar Panels for Energy Efficiency in 2026 means looking beyond a glossy efficiency rating. Solar Energy Efficiency describes how effectively a panel converts sunlight into electricity, but the number on a product sheet is only part of the story. Roof direction, afternoon shade, local temperatures, and inverter performance all affect the energy that reaches your home.
The scale of the market makes careful comparisons worthwhile. IEA PVPS reported more than 440 GW of new solar photovoltaic capacity installed worldwide in 2023. That rapid expansion brings more products—and more claims—to assess. NREL’s Best Research-Cell Efficiency Chart is a useful technical reference, but its record-setting laboratory cells are not the same as commercially available rooftop panels. Keep that distinction in mind.
This guide compares seven panel options using published specifications, including conversion efficiency, temperature performance, warranties, and practical installation considerations. A panel with a higher rating may produce more power from a small roof, yet cost more and deliver little extra value on a spacious, unshaded one. Small details matter. Real output also depends on system design and the weather your roof actually experiences. Manufacturer figures can be useful, but they are not a promise of household savings. Check current product sheets and request a site-specific estimate before deciding; even a careful comparison cannot remove every uncertainty.
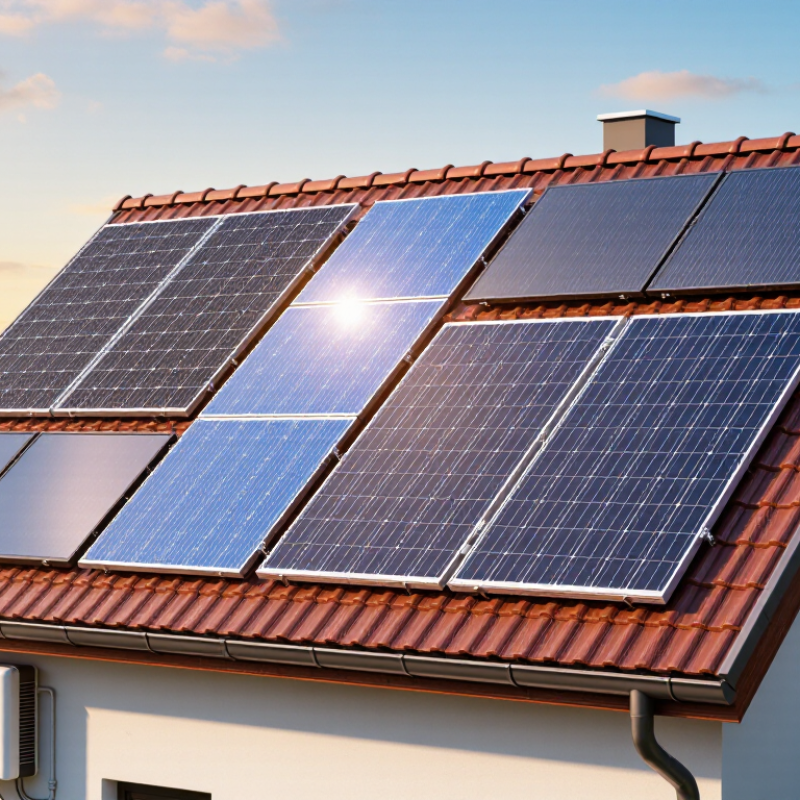
Solar panel efficiency is the share of incoming sunlight converted into electricity under defined test conditions. In 2026, ratings are still commonly measured under Standard Test Conditions: 1,000 watts of sunlight per square meter, a cell temperature of 25°C, and a specified solar spectrum. A 22% efficient module therefore produces about 220 watts per square meter in that test. Real roofs rarely match the laboratory setup.
Fraunhofer ISE’s Photovoltaics Report (2024) places commercial crystalline-silicon module efficiencies broadly in the 20–23% range. NREL’s Best Research-Cell Efficiency Chart records silicon research cells near 27%, but those laboratory results are not equivalent to finished rooftop panels. That distinction matters. Compare modules using the same test basis, and check the rated output alongside the efficiency percentage. Shade from a chimney, dust on glass, or a hot roof can reduce actual energy production. A high rating does not guarantee more electricity over a year. I would also check the panel’s area: a slightly less efficient module may suit a large, unobstructed roof just as well. Test conditions deserve a closer look.
The options below compare common solar-panel technologies, not individual products. Efficiency ranges are indicative of commercially available modules and vary by design and manufacturer; they are not guarantees or a universal ranking.
| Solar panel technology | Typical module efficiency | Approx. output density at STC | Potential fit | Efficiency-related considerations |
|---|---|---|---|---|
| N-type back-contact (BC) | 22%–25% | 220–250 W/m² | Installations where roof area is limited | Electrical contacts are placed on the rear of the cell, leaving more front surface available to receive light. Compare the actual module rating and temperature characteristics. |
| N-type TOPCon | 21%–24.5% | 210–245 W/m² | Homes or businesses seeking high output per roof area | A passivating contact design can reduce electrical losses. Module performance still depends on cell layout, materials, and operating conditions. |
| Heterojunction (HJT) | 21%–24.5% | 210–245 W/m² | Sites where warm operating conditions are a consideration | HJT cells commonly have favorable temperature behavior, but temperature coefficients differ between modules. Check the specific datasheet. |
| Monocrystalline PERC | 19%–22.5% | 190–225 W/m² | Projects prioritizing established technology and broad availability | A rear passivation layer helps capture more light. Efficiency is generally lower than that of leading newer crystalline-silicon designs. |
| Cadmium telluride (CdTe) thin-film | 17%–20% | 170–200 W/m² | Some large-scale or utility projects | Thin-film modules can perform differently from crystalline silicon in heat and diffuse light. Their lower power density may require more area for the same rated capacity. |
| Copper indium gallium selenide (CIGS) thin-film | 14%–19% | 140–190 W/m² | Specialty applications where thin-film form factors are useful | Flexible product formats may be available, depending on construction. Confirm the module’s certified rating and installation requirements. |
| Polycrystalline silicon | 15%–18% | 150–180 W/m² | Existing systems or projects where suitable modules are available | Typically provides less power per unit area than current high-efficiency crystalline-silicon options, so it may need more installation space. |
Module efficiency is the module’s rated maximum-power output divided by the solar power falling on its measured area, expressed as a percentage:
Efficiency (%) = [maximum power (W) ÷ (irradiance (W/m²) × module area (m²))] × 100
Ratings are commonly measured under Standard Test Conditions (STC): irradiance of 1,000 W/m², cell temperature of 25°C, and an AM1.5G reference spectrum. The output-density figures above are approximate conversions of the efficiency ranges at 1,000 W/m². Real-world energy production also depends on temperature, shading, orientation, tilt, inverter losses, and local weather.


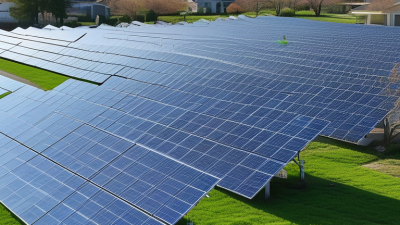
If you’re replacing your roof and already have solar panels installed, you’ll likely need solar panel removal and reinstall during the process. When planned correctly,
Florida homeowners are seeing their power bills rise faster than ever. Between AI data centers, fuel costs, and storm-related grid upgrades, utilities are increasing rates

⏳Go Solar Before the Deadline Permitting in Pinellas County solar jurisdictions is already experiencing serious delays. Plan reviews are running 4+ weeks behind. That means