How to Choose Solar Power Infrastructure for Global Projects?

Choosing Solar Power Infrastructure for global projects requires more than comparing panel prices. It demands evidence from the site, the grid, the climate, and the project’s operating reality.

IRENA’s Renewable Capacity Statistics 2025 reported 585 gigawatts of renewable capacity added worldwide in 2024. Solar power contributed approximately 452 gigawatts. The scale is impressive. It also exposes a risk: identical equipment may perform very differently across deserts, coastal zones, mountains, and humid cities. The IEA’s Renewables 2024 report expects solar photovoltaic systems to drive most renewable capacity growth through 2030. Therefore, developers must evaluate technology, supply reliability, financing, and grid readiness together.

A strong selection process begins with measured solar irradiation, temperature profiles, wind loads, dust exposure, and seasonal rainfall. It then tests inverter performance, battery needs, transformer capacity, cybersecurity, and maintenance access. A panel that performs well in a laboratory may lose output under heavy dust or extreme heat. Small details matter, such as a service road that becomes unusable after monsoon rainfall.

The World Bank’s Global Solar Atlas can support early resource screening, while bankable assessments should use site measurements and independent engineering reviews. Local installers, grid operators, and experienced owners can reveal practical constraints that datasets miss. No checklist is perfect. Procurement assumptions may fail when shipping routes change, currencies weaken, or replacement parts require months to arrive. This guide examines how to balance cost, resilience, compliance, and long-term performance when selecting Solar Power Infrastructure for projects across different markets.

How to Choose Solar Power Infrastructure for Global Projects?

Define Project Goals, Energy Needs, and Site Conditions

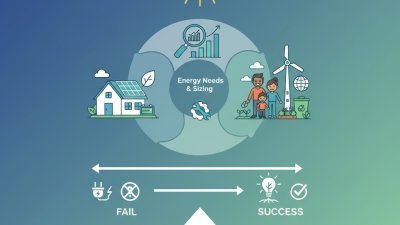
Choosing solar power infrastructure for global projects begins with a clear project brief. Define the purpose before comparing equipment. Is the system serving a remote clinic, an industrial facility, or a weak grid? Each goal changes the design. Record daily loads, seasonal peaks, critical circuits, and acceptable outage time. Do not rely on one monthly electricity bill. It can hide short, heavy demand.

Site conditions decide whether a promising plan survives field operation. Measure solar irradiance across seasons, not only during a bright site visit. Check roof orientation, ground stability, shading, drainage, and maintenance access. In dusty or humid regions, cleaning frequency and corrosion protection become practical design inputs. High wind or snow loads may require stronger mounting and additional engineering review. Grid quality matters too. Voltage swings can affect inverters, batteries, and sensitive equipment. Local codes, permits, and utility rules should be confirmed by qualified professionals.

Match capacity to the real energy strategy. Batteries may support night loads, backup circuits, or unstable grid periods, but usable capacity falls with temperature and age. Specify safety controls, monitoring, spare parts, and technician training early. Field reviews often show projects overvaluing peak output and undervaluing maintenance access. That mistake is expensive. A smaller array with clear service routes may perform better than a larger array squeezed onto a difficult site. Early simulations are useful, but they are not field truth. Recheck assumptions after surveys and pilot measurements.

Compare Solar Technologies, System Designs, and Infrastructure Scales

Choosing solar infrastructure for global projects starts with technology, not slogans. Crystalline-silicon modules remain the mainstream option because manufacturing capacity and field data are extensive. Thin-film modules can perform better in high heat or diffuse light, but their larger land requirement may complicate transport. Bifacial modules can increase yield on reflective ground. The result depends heavily on albedo, row spacing, and cleaning access. IRENA’s Renewable Capacity Statistics 2024 reported 1,419 GW of global solar capacity at the end of 2023. Scale is expanding quickly.

System design changes the economics. Fixed-tilt arrays usually reduce mechanical risk and maintenance needs. Single-axis tracking can raise production, especially in high-irradiance regions, but it adds moving parts and storm exposure. Lazard’s Levelized Cost of Energy Analysis, Version 17.0, placed utility-scale solar costs near $29–92 per MWh before storage and project-specific adjustments. That range is useful, but not universal. Grid connection delays, land grading, taxes, and financing can dominate the module price.

Infrastructure scale should match local demand. Rooftop systems suit constrained sites and reduce distribution losses. Commercial systems need careful load profiling, because daytime generation may not match factory operations. Utility projects need transmission capacity, cybersecurity, spare parts, and water-aware cleaning plans. Remote microgrids often require batteries and backup generation for cloudy periods. The IEA’s Renewables 2024 report expects solar PV to provide most renewable capacity growth through 2030. That forecast supports expansion, but it does not remove site risk. Reality is messier. A technically efficient design can still fail when dust, weak grids, or local skills are underestimated.

How to Choose Solar Power Infrastructure for Global Projects? — Compare Solar Technologies, System Designs, and Infrastructure Scales
Category Option Typical Commercial Module Efficiency Indicative Power Density or Land Requirement Best-Fit Project Conditions Key Advantages Main Constraints Infrastructure Considerations
Solar Technology Monocrystalline silicon PV 20%–24% Approximately 1.0–1.5 MWdc per hectare for utility-scale sites, depending on layout and terrain Most climates, including residential, commercial, industrial, and utility-scale applications High efficiency, mature supply chain, strong performance in limited-area installations, widely available installation expertise Performance decreases with high operating temperatures; silicon and glass manufacturing require significant energy and materials Requires suitable mounting structures, DC cabling, inverters, protection equipment, monitoring, and grid interconnection
Solar Technology Bifacial crystalline silicon PV 20%–24% Site footprint is similar to conventional crystalline silicon; energy yield can increase by approximately 5%–15% with favorable albedo and spacing High-albedo ground surfaces, open utility sites, snow-prone regions, and elevated systems with low rear shading Generates electricity from front and rear surfaces; can improve yield without proportionally increasing module area Rear-side gain depends strongly on ground reflectivity, row spacing, height, shading, and system design Use elevated mounting, optimized row spacing, compatible trackers or fixed structures, and accurate bifacial yield modeling
Solar Technology Thin-film PV Approximately 10%–19% Generally requires more module area than crystalline silicon for the same rated capacity Large sites, warm climates, diffuse-light conditions, and projects where temperature performance or low-light response is important Can offer favorable temperature coefficients, good diffuse-light performance, and relatively uniform appearance Lower power density can increase land, structure, wiring, and balance-of-system requirements Check local supply availability, recycling pathways, mounting compatibility, and area requirements before procurement
Solar Technology Concentrated photovoltaic systems Approximately 30%–40% at the cell level; system efficiency is lower Potentially high direct-normal-irradiance power density, but land requirements depend on optical spacing and tracking layout Very high direct-normal-irradiance regions with clear skies and strong solar resource High conversion efficiency under suitable direct sunlight; reduced semiconductor area per unit of output Limited performance under clouds or diffuse light; requires precise tracking, cleaning, and specialized maintenance Needs accurate solar-resource assessment, dual-axis tracking, optical alignment, and reliable operations capability
System Design Fixed-tilt ground-mounted system Typical capacity factor: 15%–25% Approximately 1.0–3.0 hectares per MWdc, depending on latitude, tilt, row spacing, terrain, and access roads Large land parcels with moderate to high solar irradiation and predictable long-term site access Lower mechanical complexity, easier maintenance, and generally lower operating risk than tracking systems Lower annual energy yield than trackers in many high-irradiance locations Assess geotechnical conditions, drainage, flood risk, wind and snow loads, internal roads, fencing, and transmission access
System Design Single-axis tracking system Typical capacity factor: 20%–30% Approximately 1.2–3.5 hectares per MWdc, depending on tracking geometry, terrain, and row spacing High-irradiance utility projects with relatively flat terrain and sufficient land for row-to-row movement Usually increases energy production by approximately 15%–25% compared with fixed tilt in suitable locations Higher capital cost, moving components, wind-stow requirements, and greater maintenance complexity Require robust controls, spare parts, cybersecurity, wind monitoring, compatible terrain grading, and specialized maintenance procedures
System Design Rooftop PV system Typical capacity factor: 10%–20% Uses existing roof area; commonly about 5–10 m² of roof area per kWdc, depending on module efficiency and access clearances Homes, warehouses, offices, schools, hospitals, and industrial facilities with structurally suitable roofs Uses existing built surfaces, reduces distribution losses, and can offset daytime electricity demand Roof age, structural loading, shading, fire access, orientation, and tenant or ownership arrangements can limit deployment Verify structural capacity, waterproofing, fire setbacks, rapid shutdown requirements, electrical service capacity, and maintenance access
System Design Floating PV system Typical capacity factor: 15%–25% Often requires approximately 1–2 hectares of water surface per MWdc, depending on coverage ratio and spacing Reservoirs, irrigation ponds, quarry lakes, and other suitable inland water bodies with controlled water-level variation Preserves land, can reduce evaporation, and may benefit from module cooling over water Anchoring, corrosion, waves, water-level variation, ecological impacts, and access for inspection require careful management Study bathymetry, water quality, anchoring loads, navigation, aquatic ecology, electrical isolation, and emergency access
System Design Agrivoltaic system Project output varies widely; often lower module density than conventional ground PV Land requirement is site-specific because crop rows, machinery routes, and module spacing must be integrated Farms where solar generation can coexist with crops, grazing, greenhouses, or water-management objectives Supports dual land use, can provide shade or shelter for selected crops, and may diversify farm income Potential conflicts with machinery access, crop requirements, agricultural productivity, and permitting rules Design around crop height, irrigation, farm equipment, stormwater flow, fencing, glare, and long-term land-management responsibilities
Infrastructure Scale Residential solar-plus-storage Common PV size: 3–15 kWdc; battery: approximately 5–30 kWh Typically requires 15–150 m² of usable roof area, depending on system size and module efficiency Homes with high retail electricity prices, reliability concerns, or limited grid export availability Reduces purchased electricity, can provide backup power, and supports household energy resilience Limited roof area, battery cost, local interconnection rules, and replacement planning Coordinate inverter capacity, critical-load panels, battery location, ventilation, fire safety, and utility protection settings
Infrastructure Scale Commercial and industrial distributed PV Common PV size: 100 kWdc–10 MWdc; storage is project-specific Roof and carport area commonly requires about 5–10 m² per kWdc, excluding additional service and access areas Factories, logistics centers, retail buildings, campuses, water facilities, and other daytime-load customers Can offset high daytime consumption and reduce exposure to demand or energy charges Large loads may require transformer upgrades; roof leases, building ownership, and operating schedules add complexity Evaluate load profiles, power-quality requirements, behind-the-meter controls, export limits, roof warranties, and medium-voltage equipment
Infrastructure Scale Utility-scale solar park Common project size: 10 MWdc–1,000+ MWdc Approximately 1.0–3.5 hectares per MWdc, depending on technology, tracking, terrain, setbacks, and infrastructure Regions with available land, strong solar resources, transmission capacity, and bankable long-term electricity offtake Economies of scale, centralized operations, high-voltage grid integration, and efficient procurement Long development timelines, land and transmission constraints, environmental review, and curtailment risk Plan transmission studies, substations, collection systems, roads, drainage, forecasting, cyber controls, spares, and end-of-life restoration
Infrastructure Scale Hybrid solar, storage, and grid-support system PV and battery sizes are configured according to load, dispatch, and grid requirements Land area depends on the PV-to-storage ratio, battery technology, fire setbacks, and substation layout Weak grids, islands, remote communities, peak-demand markets, and projects requiring firmed or time-shifted output Improves dispatchability, reduces renewable curtailment, supports frequency response, and can provide backup capacity Higher integration complexity, battery degradation, thermal management needs, and additional safety requirements Define operating modes, energy-management controls, interconnection studies, fire protection, thermal systems, warranties, and replacement budgets
Indicative values are planning ranges rather than guaranteed project results. Actual efficiency, capacity factor, land use, energy yield, and storage sizing depend on latitude, solar resource, weather, module characteristics, system losses, terrain, permitting, grid conditions, and operating strategy.

Evaluate Grid Access, Storage Options, and Backup Power Requirements

Grid access often decides whether a solar project is practical or merely attractive on paper. Assess the nearest substation, available capacity, connection voltage, and expected approval timeline. A site near a transmission line may still face expensive upgrades. Request recent outage records, not only utility promises. Check whether roads can support transformers and maintenance vehicles during wet seasons.

Storage should match the project’s real load pattern. A battery can shift midday solar power into evening demand, but it cannot solve every reliability problem. Measure peak loads, overnight consumption, temperature changes, and seasonal sunlight. In hot climates, cooling equipment can reduce usable capacity. Allow room for degradation. The spreadsheet may look convincing, yet one missing load profile can distort the entire design.

Backup power requires careful separation of essential and nonessential circuits. Hospitals, water pumps, communications, and control systems may need different response times. Define how long critical loads must operate during cloudy weather or grid failure. Consider fuel delivery, fire protection, noise limits, local codes, and trained operators. A backup generator may seem cheaper, but fuel access can become uncertain after storms or border delays. I would not pretend every project needs the same reserve. Recheck assumptions with local engineers, utility staff, and people who will operate the system daily.

Assess Local Regulations, Supply Chains, Costs, and Project Risks

How to Choose Solar Power Infrastructure for Global Projects?

Solar infrastructure must fit local rules before it fits the site. Regulations differ. Developers should verify land rights, environmental permits, grid codes, tax treatment, and local-content requirements early. The International Energy Agency expects solar photovoltaic systems to provide nearly 80% of global renewable capacity expansion from 2024 to 2030. That scale increases scrutiny. A permit delay can leave imported equipment waiting at a port, accumulating storage charges.

Supply-chain planning needs more than a supplier list. Check component origin, factory capacity, shipping routes, replacement parts, and warranty enforcement. The International Energy Agency reports that China supplied over 80% of global solar module manufacturing capacity in 2023. This concentration can reduce prices, but it also exposes projects to trade restrictions, freight disruption, and currency movements. Rules differ. Local service capability matters.

Cost comparisons should include grid upgrades, insurance, financing, construction labor, and eventual recycling. IRENA’s Renewable Power Generation Costs in 2023 reported a global weighted-average utility-scale solar LCOE of about USD 0.044 per kilowatt-hour, down 12% from 2022. Yet this benchmark is not a project budget. I would not trust it without site-level engineering. Scenario testing should model delays, weaker irradiation, equipment replacement, and curtailment. A spreadsheet can miss political change. Independent technical reviews, documented assumptions, and staged procurement make those gaps easier to challenge.

Select Reliable Components, Partners, and Long-Term Maintenance Plans

Choosing solar infrastructure for global projects requires more than comparing module efficiency. Reliability begins with components that fit the climate, grid code, and maintenance capacity. IRENA’s Renewable Capacity Statistics 2024 recorded more than 1,400 GW of global solar capacity by the end of 2023. That scale increases pressure on procurement teams. A component failure can affect spare parts, worker access, and revenue across several countries.

Use independent test reports, traceable warranties, and documented quality controls. Check temperature ratings, corrosion resistance, wind loads, fire performance, and cybersecurity for connected equipment. NREL research commonly places crystalline-silicon module degradation near 0.5% per year, but field conditions can produce different results.

Dust matters. So do heat, humidity, and poor cleaning practices. A practical design should include monitoring sensors, accessible cable routes, and locally available replacement parts. Small details decide downtime.

Partners need more than a low installation price. Require evidence from comparable climates, trained technicians, response-time commitments, and clear responsibility after commissioning. The IEA’s Renewables 2024 report highlights the continuing expansion of solar deployment, which makes long-term service capacity increasingly important. Build maintenance plans around inspections, thermal imaging, inverter testing, vegetation control, and performance reviews. Review them annually. Some plans look complete on paper but fail during a parts shortage. That is worth admitting early. Test the plan with a simulated fault before the first major failure.

Stop Paying More for Power

Utility rates rise 4–6% every year. Solar converts that rising expense into an asset that can pay for itself, and once it’s paid off, your power is essentially free. Many property owners qualify with no money out of pocket.